How to Analyze Geospatial Data in VIDIZMO
VIDIZMO's geospatial analysis feature enables you to visualize and analyze geographic information (geospatial data) alongside your content. You can use this to track the movement and location of objects or targets during playback. This feature is available for all content types, including images, videos, documents, and audio files.
To display a geospatial map during playback, your content must include KLV (Key-Length-Value) data. Some content, like drone videos, already contains embedded KLV data. When you upload such content, VIDIZMO automatically extracts this data and displays the geospatial map during playback, providing location information based on the extracted data. If your content does not contain embedded KLV data, VIDIZMO allows you to upload timed data files to include this information. Once a timed data file is added, VIDIZMO will display the geospatial map during playback according to the data obtained from the timed data file.
For more information on uploading timed data, see Upload Your First Media in VIDIZMO.
Prerequisites
- Membership in a group with the GeoSpatial Mapping feature enabled, or a CAL that grants permission to utilize it.
- If your video does not have embedded KLV metadata, prepare a timed data file in a supported format (such as
.csv) to display the geospatial map during playback.
Upload Content with Embedded Geospatial Data
When you upload content with embedded KLV data, VIDIZMO automatically extracts and synchronizes the data for display on a geospatial map.
- In the Evidence Library, select + Add New > Upload Evidence.
- Upload the file containing embedded KLV data.
- After processing completes, select the uploaded file to open its playback page.
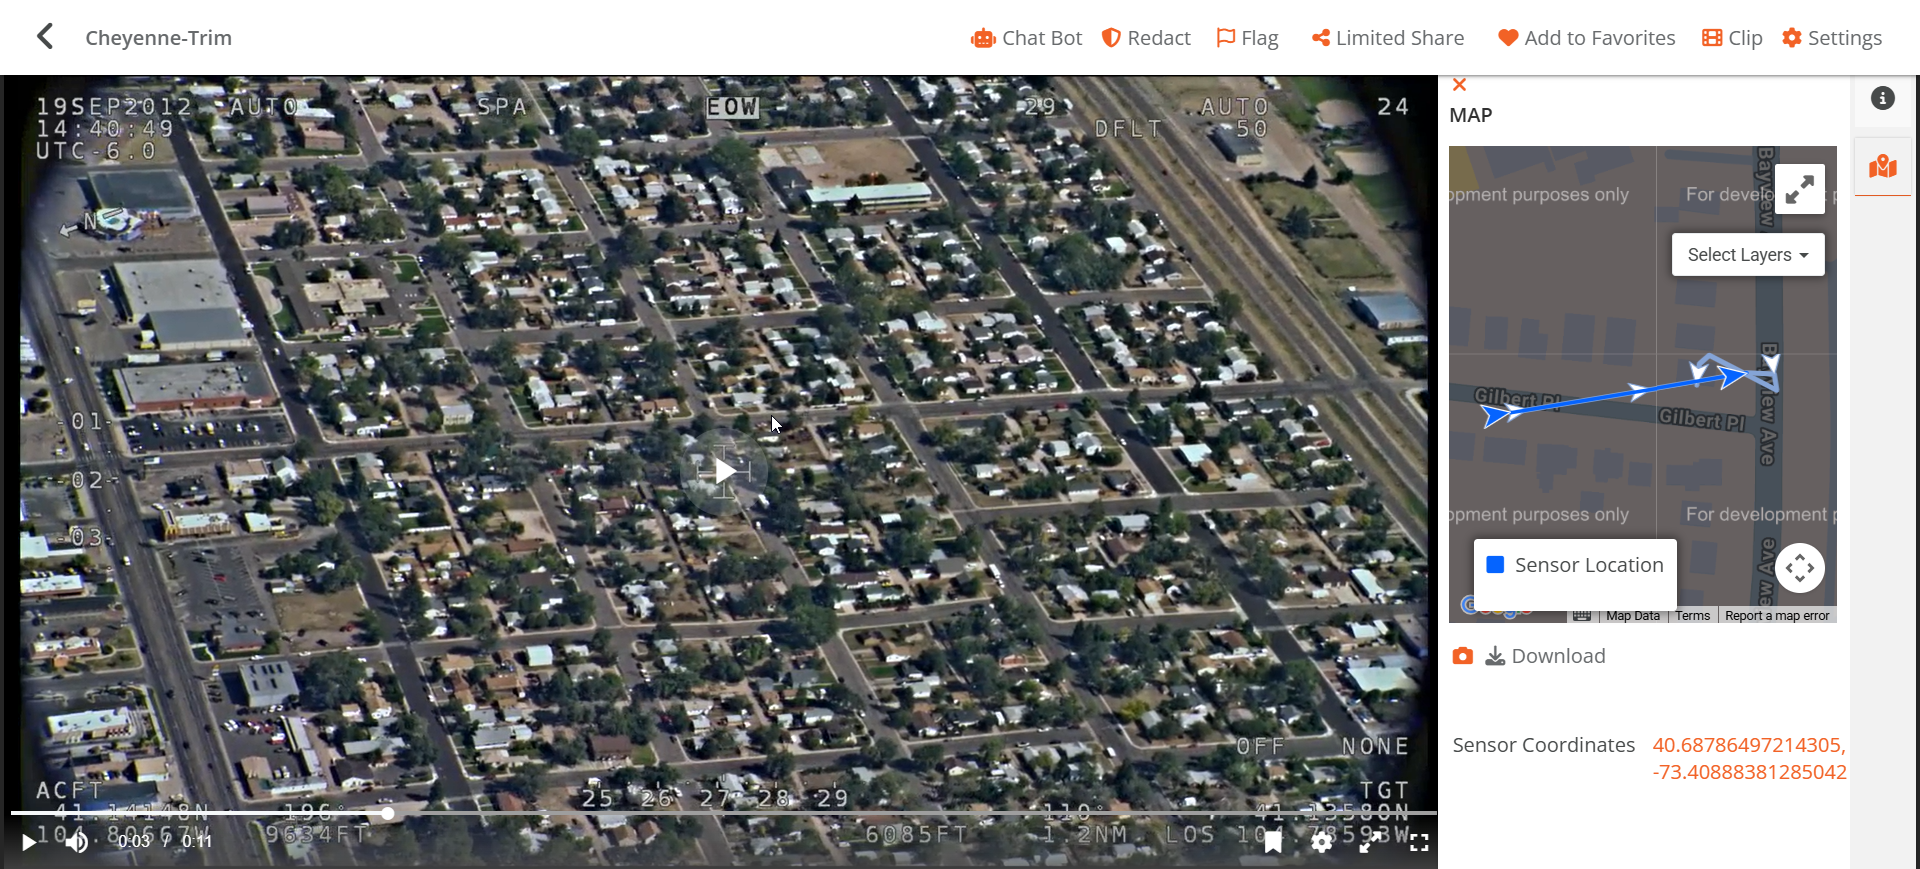
- On the playback page, select the Map tab to display the geospatial map.
The extracted KLV data is automatically synchronized and displayed alongside the file's playback. Refer to the Analyze Geospatial Data section to understand the elements shown on the geospatial map. You can also download the embedded timed data in .vtt format from its settings.
NOTE: If your drone video file (such as
.ts) does not play correctly, ensure the file is transcoded.
Add Timed Data Files to Content
If your content does not have embedded KLV metadata, you can manually upload a separate timed data file (.vtt, .srt, or .csv) to display geospatial data alongside your content.
- In the Evidence Library, select the overflow menu (⋮) next to your content, then select Settings.
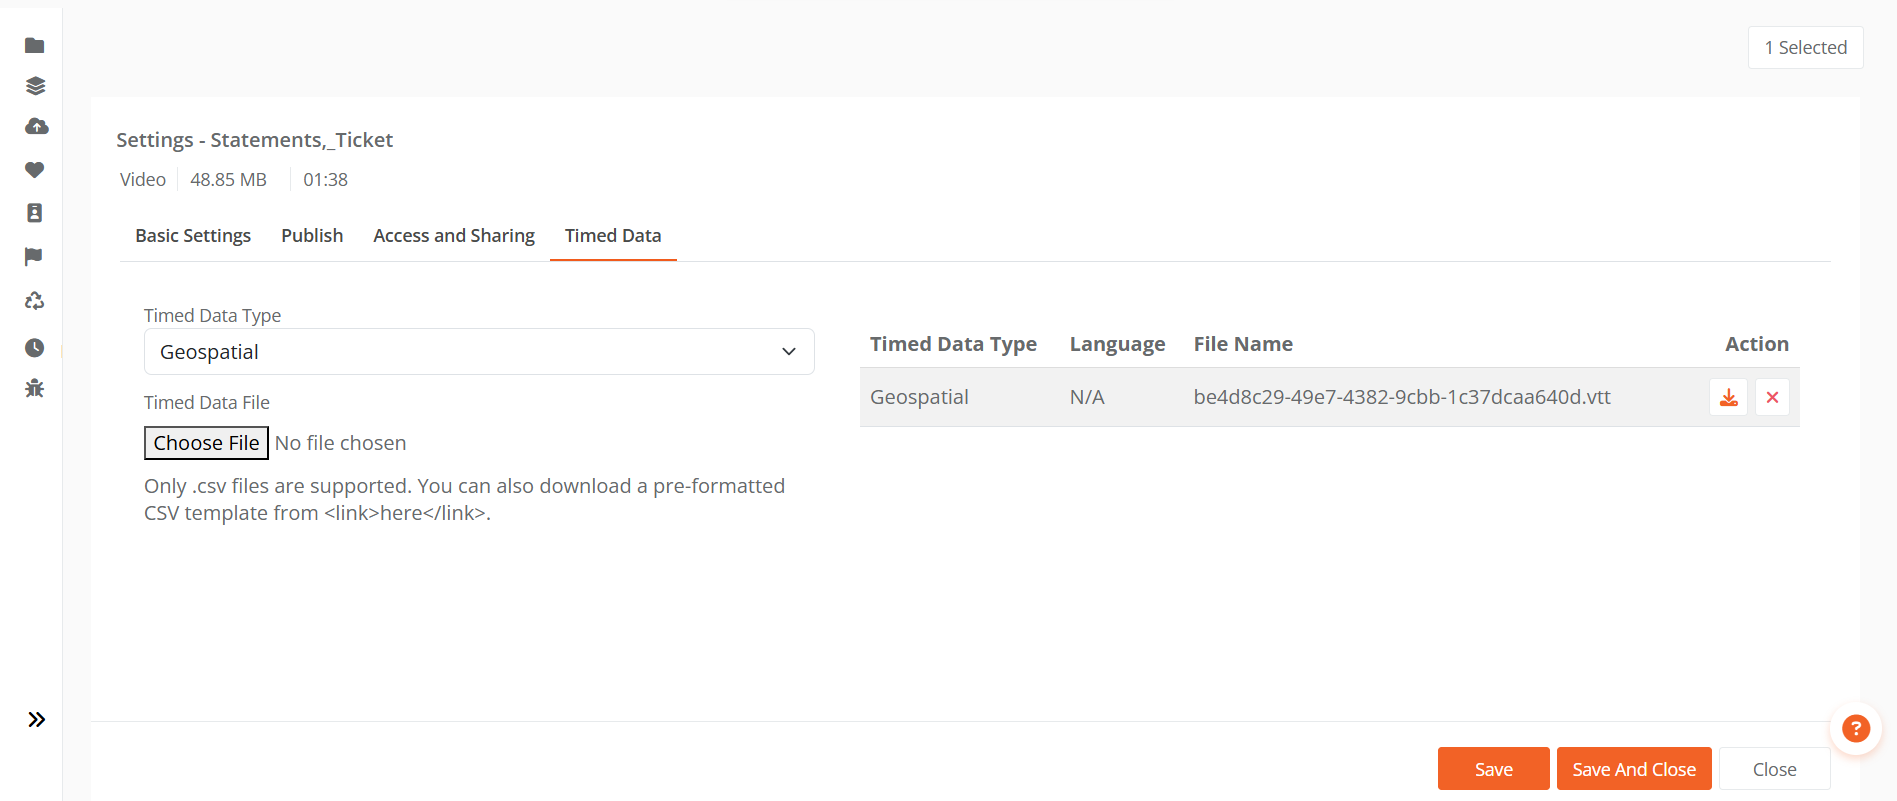
- Select the Timed Data tab.
- Under Timed Data Type, select one of the following options:
- Drone: Available only for video files. Supports
.vttand.srtformats. - Geospatial: Available for video, image, and document files. Supports
.csvformat.
- Drone: Available only for video files. Supports
- In the Timed Data File section, select Choose File and upload your timed data file. You can also download a pre-formatted CSV template.
- The uploaded file appears on the right, along with any previously uploaded timed data files. You can remove it or download the metadata in
.vttformat. - Select Save or Save and Close.
- Return to the Evidence Library and select your content to open the playback page, then select the Map tab to view the geospatial map.
To learn more about supported file formats and constraints for timed data, see Understanding Geospatial Analysis in VIDIZMO.
Analyze Geospatial Data
You can view and analyze the geospatial data and track the movement of targets on the map displayed on the content's playback page.
Map View Controls
- Map/Satellite toggle: Select Map for the 2D Street View (default), or select Satellite for real-world satellite imagery.
- Expand: Toggle between full-screen and normal screen views of the map.
- Map Camera Control: Use the + and – buttons to zoom in and out, or use the directional buttons to pan the map view.
Map Layers
Select Select Layer to visualize the trajectories of the source (e.g., drone or bodycam) and target (object being tracked) on the map. The available layers are:
- Sensor Location: Displays the trajectory of the recording device, such as a drone or body camera. This path is shown as a blue line on the map.
- Frame Center Location: Displays the trajectory of the tracked object or target captured by an embedded sensor. This path is shown as an orange line on the map.
When analyzing videos and audio files, both the source and target positions dynamically update and move along their respective trajectories during playback. For images and documents, the positions remain static.
Geospatial Data Details
The detailed geospatial data (including timestamp, latitude, and longitude) provided by embedded KLV or timed data files is displayed below the map. For videos, this data updates dynamically as the video plays. Images and documents display only a single static data point, derived from a .csv file containing one entry.
Export Geospatial Data
To export the geospatial data, select Download below the map. The KLV data downloads as a .csv file.